For the first time, app developers and monetization teams have an independent, data-backed answer to a question the industry has been avoiding: which ad networks actually keep your users safe, and which ones don’t?AppHarbr’s In-App Ad Network Quality Index is the first ranking of its kind. Built in collaboration with a global portfolio of apps and game studios, it evaluates the ecosystem’s state of ad quality across three dimensions that directly affect revenue and retention: user safety, user experience, and ad content quality, across gaming and non-gaming environments and multiple geographies.
The methodology is based on live traffic data, not self-reported compliance. It covers November 2025 through January 2026, evaluating more than 30 ad networks across 500 apps and 25 billion analyzed impressions.
The Ad Quality Tax
The data makes one point unavoidable: ad quality is a consistent, measurable tax on growth that most teams have no visibility into.
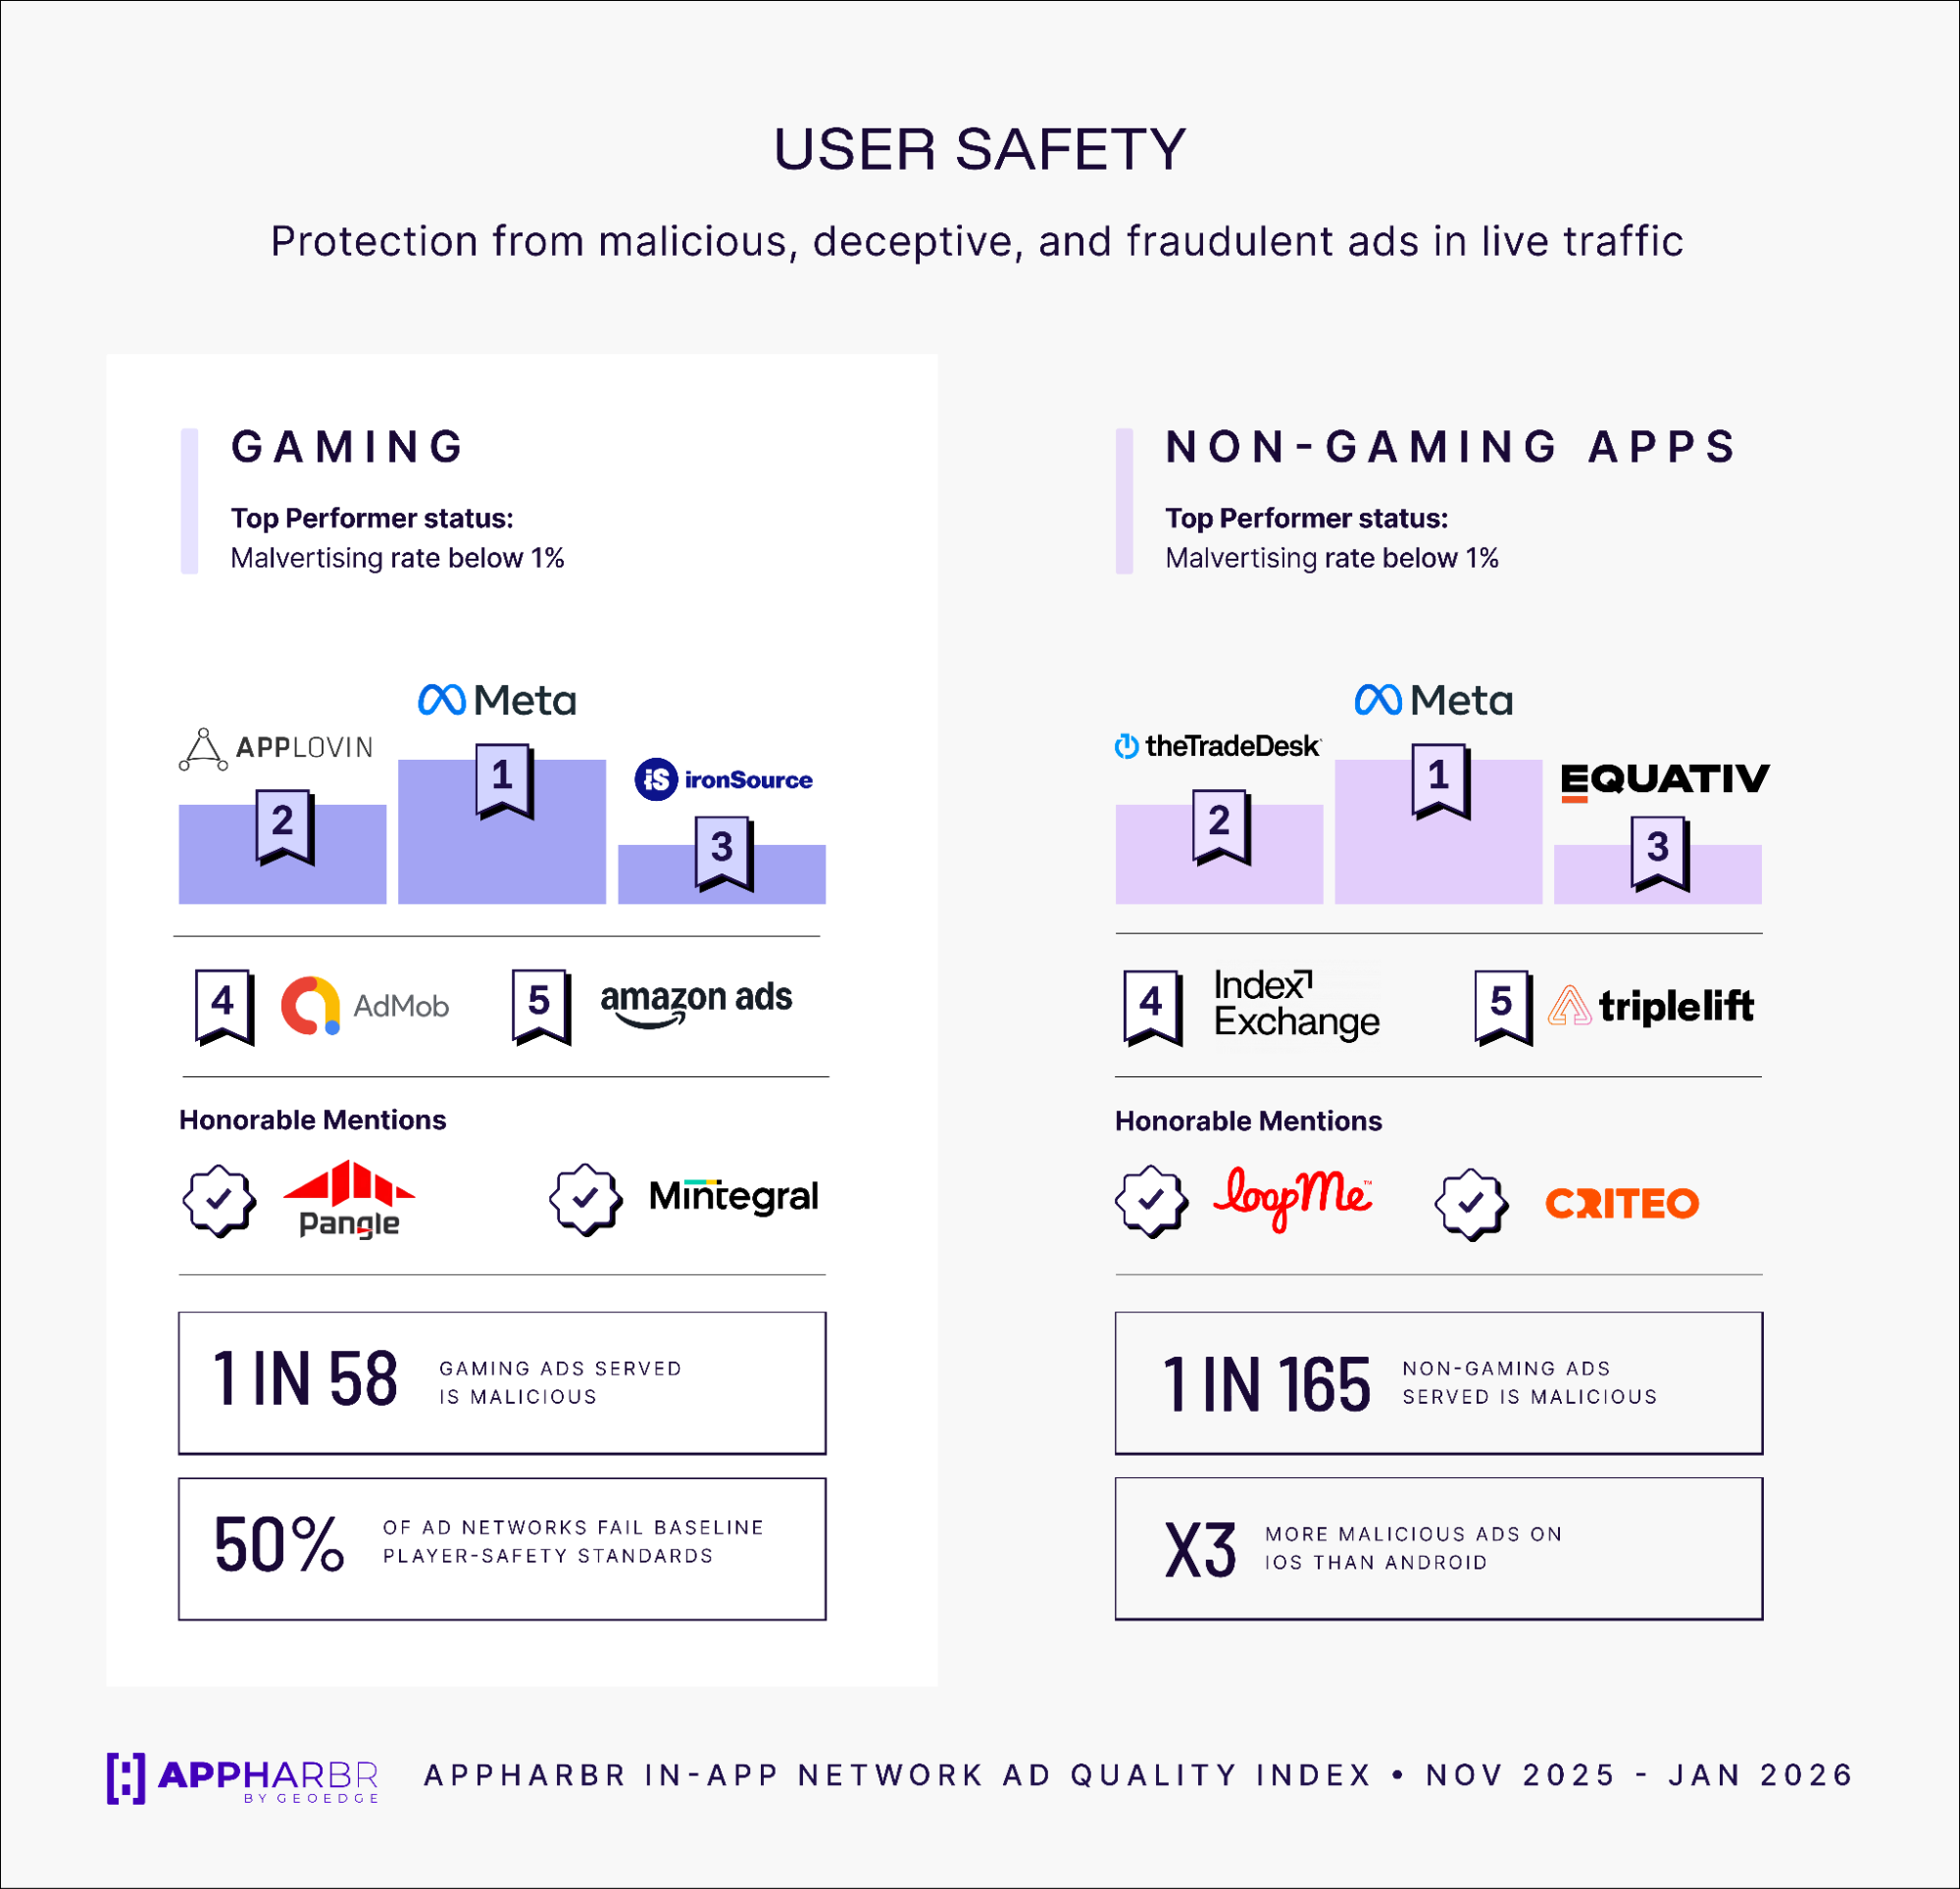
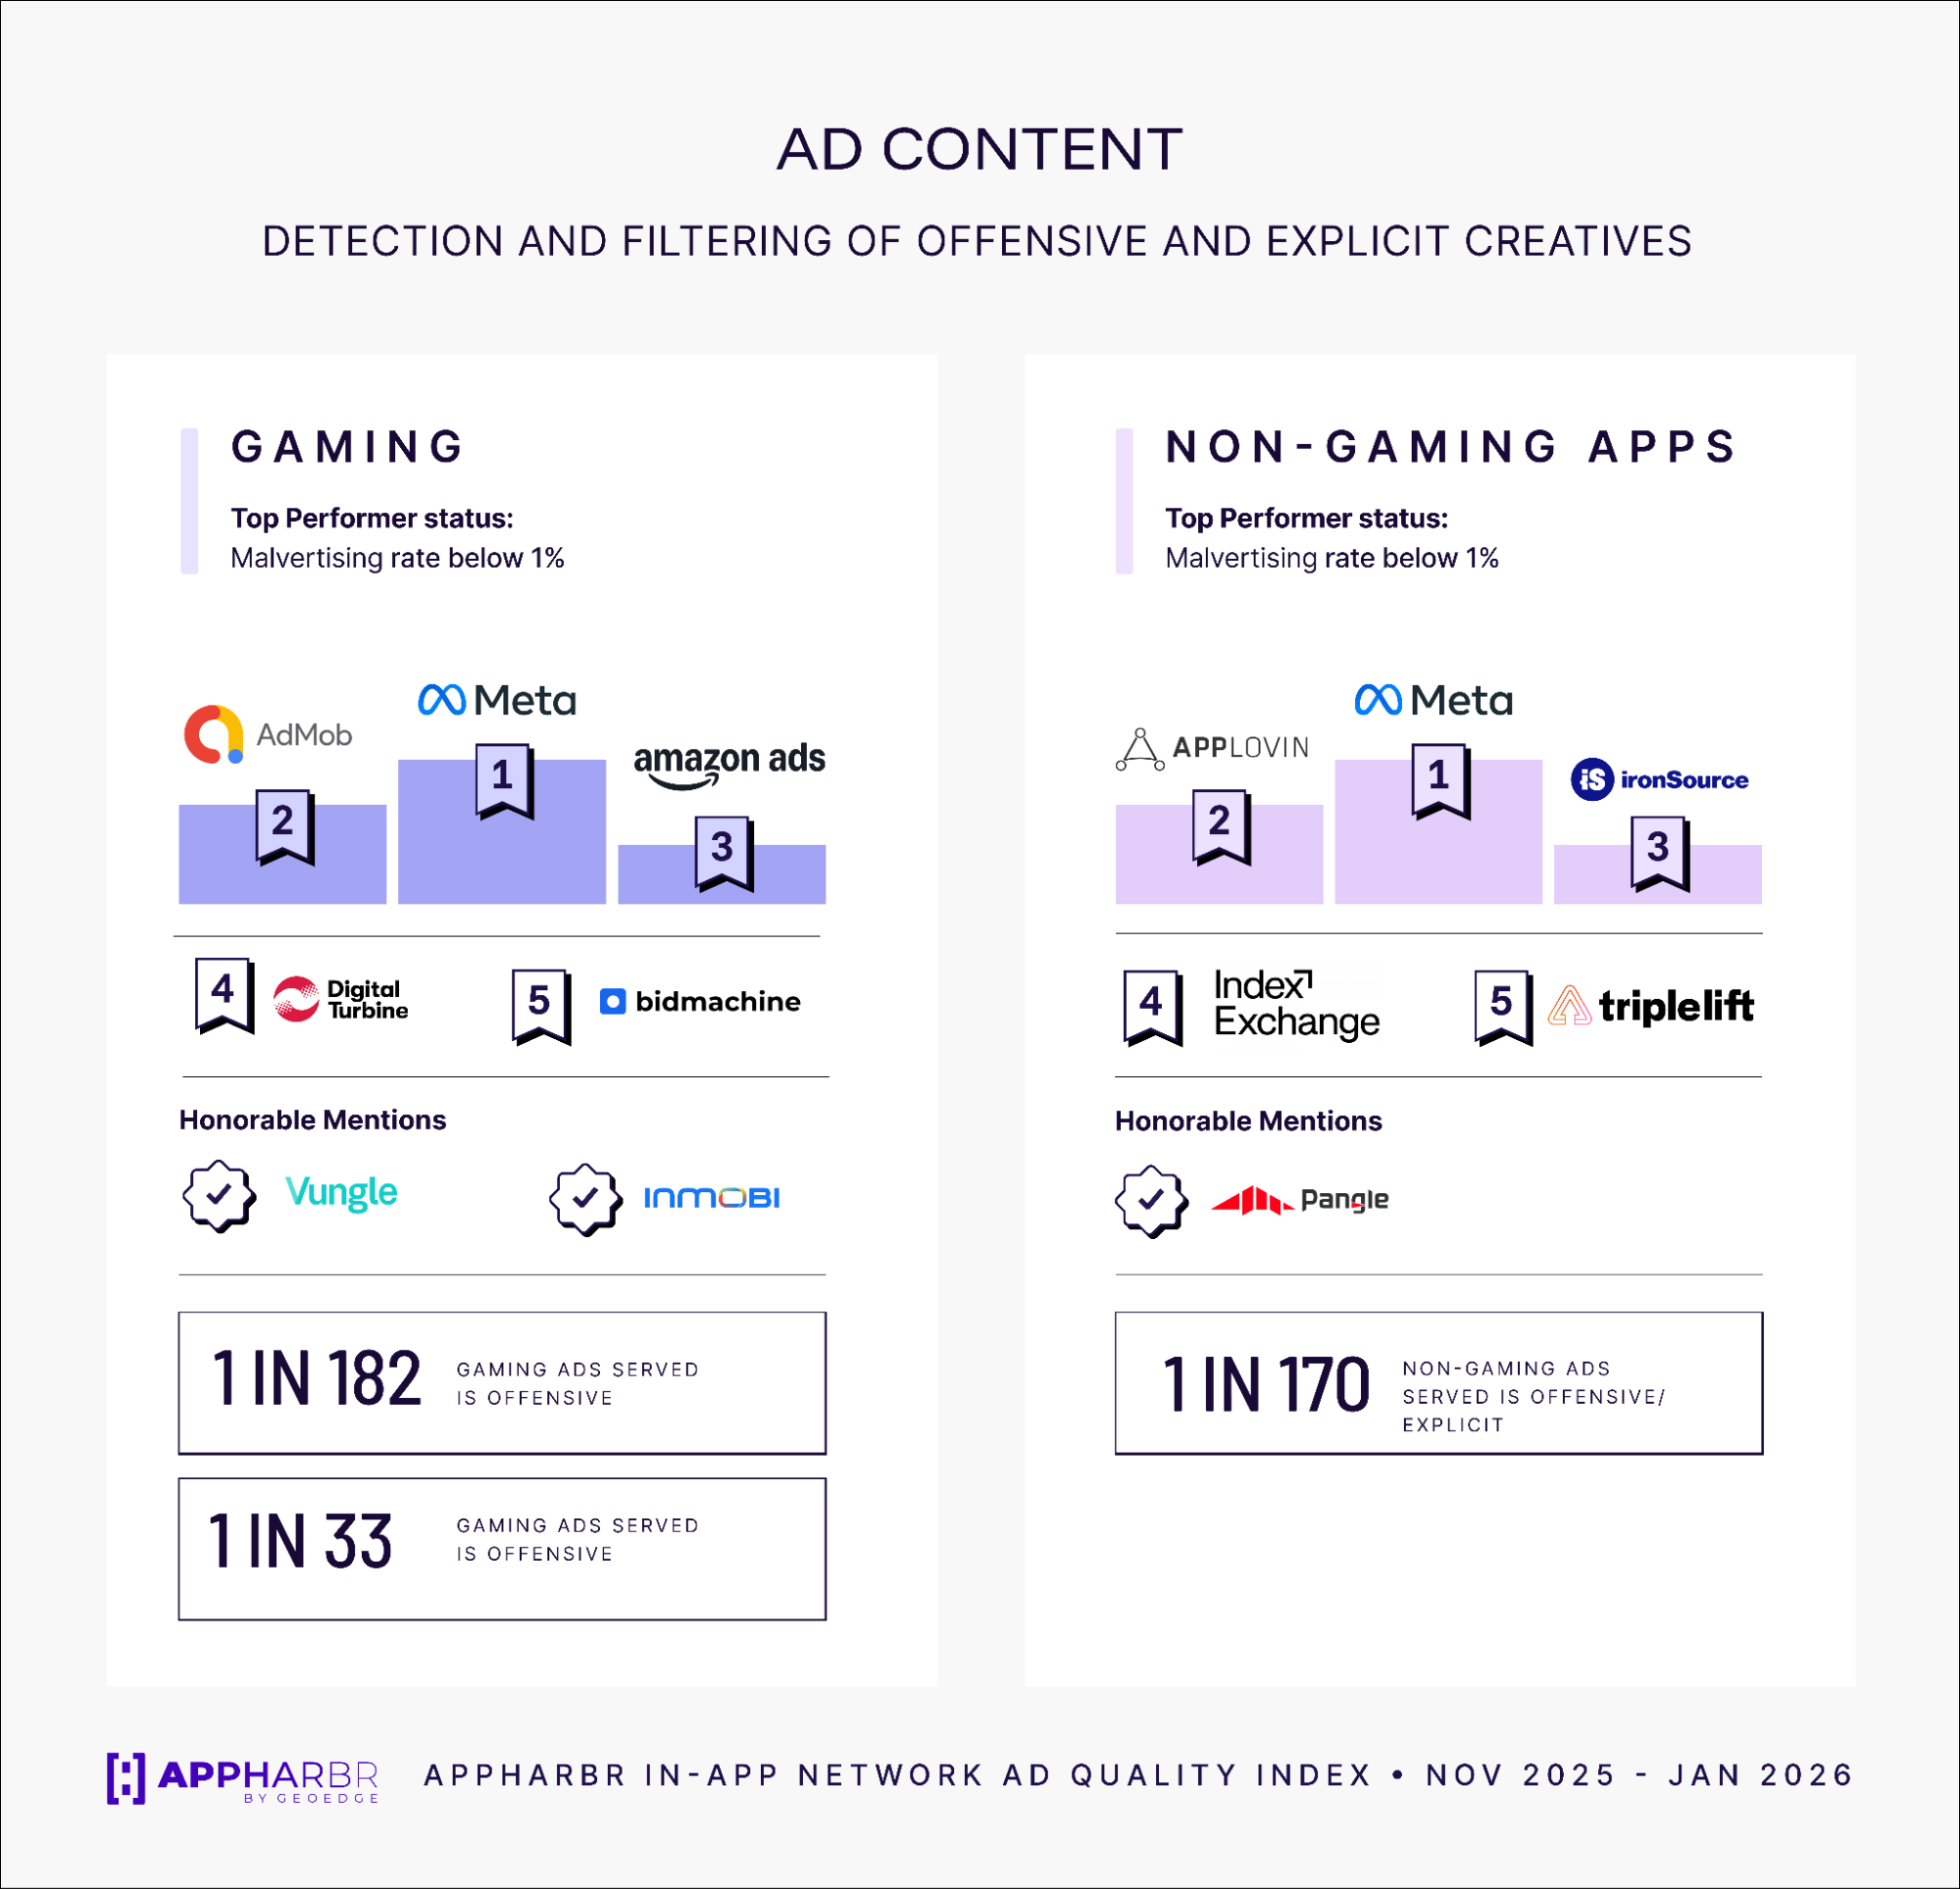
In gaming environments, 1 in 58 ads is malicious, exposing players to phishing, scams, and forced redirects in every session. 1 in 182 falls into offensive or sensitive categories. User experience violations are even more pervasive: every 5th interstitial and every 10th rewarded ad is unskippable, with the industry having quietly normalized stretching 15–30 second ads into 60–80 second experiences.
In non-gaming apps, malicious ads appear at roughly 1 in 165 impressions, and offensive or sensitive content at about 1 in 170.
When you translate those ratios into real user journeys, the picture gets uncomfortable fast. A single bad ad experience can undo the value of dozens of good ones, quietly compressing LTV, increasing support burden, and making UA progressively less efficient. 84% of players uninstall games due to negative ad experiences. That’s not a quality problem. That’s a revenue problem.
User Safety: Half the Industry Is Failing
Malvertising remains a critical threat in gaming traffic. Roughly 50% of ad networks failed to meet player-safety requirements, a striking number given how central trust is to long-term retention.
Meta led on player safety, with AppLovin and ironSource close behind. Amazon Ads, Pangle, and Mintegral are narrowing the gap, a signal that the bar is rising across the industry.
iOS apps experience approximately 3x more bad ads than Android, because high-value iOS audiences command higher CPMs, making them a more attractive target for fraudulent demand. Outside gaming, header bidding SDKs are reshaping the safety landscape. Aside from Meta, the strongest non-gaming performers deliver demand through header bidding infrastructure rather than traditional network SDK routes.
User Experience: A System-Wide Skippability Crisis >
The index delivers one of its bluntest conclusions on user experience. The acceptable benchmark violation rate for skippability is 1%. The networks closest to that standard still recorded a 10% violation rate. Every single evaluated network failed to meet the benchmark, without exception.
Moloco, Meta, and AdMob performed relatively better on interstitial duration enforcement. AdMob, InMobi, and Meta led on rewarded. On auto-play sound, InMobi and Vungle stood out for interstitials, and InMobi and AppLovin for rewarded.
The business consequence is direct: experience violations push users away at the exact moment you’re trying to monetize them, dragging down ARPU and making every UA dollar work harder than it should.
Ad Content: Progress, But Leakage Persists
In gaming, Meta and AdMob led on content compliance, with Amazon Ads, Digital Turbine, and BidMachine also ranking highly. Across non-gaming, LoopMe, TripleLift, Equativ, The Trade Desk, and Criteo showed the strongest performance in preventing offensive and policy-violating creatives from reaching users.
Despite existing controls, problematic content still reached users at scale. No supply path is fully clean, but the gap between the best and worst performers is wide enough to matter for ASO, store ratings, and organic discovery.
A New Lens on Network Performance
eCPM is still the headline metric for most monetization teams, but it increasingly fails to capture what happens after an ad is served: malvertising risk, disruptive experiences, and brand-damaging creative. The index doesn’t argue that eCPM should be abandoned. Revenue matters, and networks that generate strong yield deserve credit for it.
What the index provides is the missing second axis, a way to cross-reference yield with quality, and to ask not only which network pays the most, but which ones do so without quietly eroding the user base that makes monetization possible in the first place.
For app developers and monetization teams, this is a starting point that hasn’t existed before.
Download the full report to explore complete rankings across user safety, user experience, and ad content, including breakdowns by network, OS, region, and format.
Want to see how AppHarbr measures and enforces ad quality in real time? Learn more at appharbr.com.